You’ve watched silver bounce between $15 and $30 for over a decade, occasionally spiking but never really sustaining momentum.
I’ve sat through these cycles too. I’ve watched countless investors get excited during brief rallies only to see prices collapse back into familiar ranges.
The frustration of holding positions through these whipsaw moves tests even the most patient market participants.
Something fundamentally different is happening now. Silver broke through $40 in 2024, touched $54.49 in October 2025, and institutional analysts are suddenly talking about price targets that would have seemed ridiculous just two years ago.
This goes beyond another temporary spike driven by speculation or a weak dollar.
Want to understand what’s really driving this transformation? In this article you’ll uncover the structural forces behind the silver supercycle thesis, why this rally differs from previous failures, and what signals suggest whether this trend has genuine staying power or represents another false start.
Understanding Supercycles vs. Regular Bull Markets
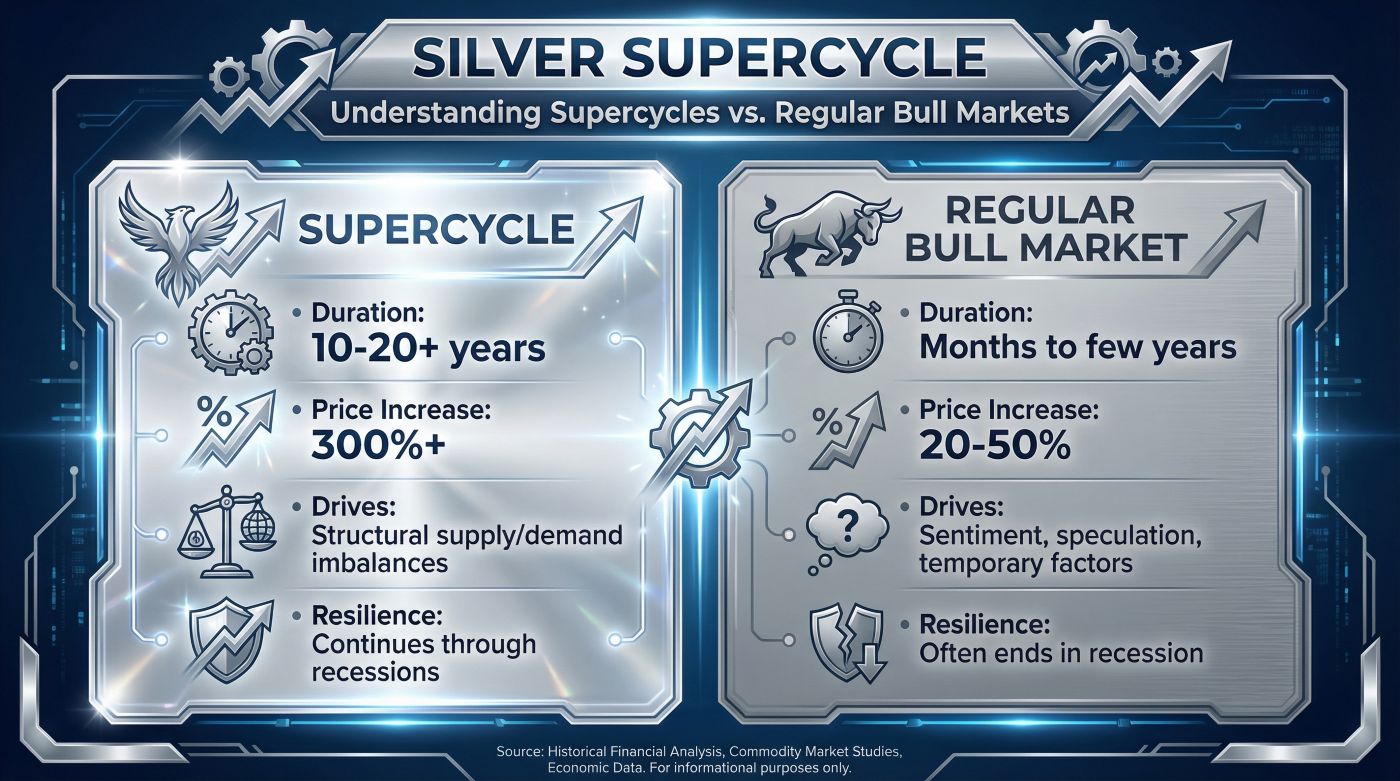
The term “supercycle” gets thrown around carelessly in commodity markets, but it carries specific meaning. A genuine supercycle describes extended price appreciation lasting 10-20+ years, driven by structural changes in supply and demand that cannot be quickly resolved. These differ dramatically from bull runs that last months or even a few years.
Historical supercycles typically deliver price increases of 300% or more, distinguishing them from smaller rallies. The 2008-2011 silver rally, for instance, gained about 150% before collapsing, which doesn’t qualify as a supercycle despite generating substantial returns.
True supercycles continue through economic cycles, recessions, and market corrections because fundamental imbalances stay unresolved.
Three major commodity supercycles occurred in modern history. The first accompanied US industrialization in the early 1900s.
The second emerged during pre-Second World War rearmament.
The third followed post-war reindustrialization of Europe and Japan. Each lasted 15-25 years and completely reshaped commodity markets.
What separates these periods from regular bull markets is the combination of unstoppable demand growth meeting constrained supply. When China industrialized during the 1990-2010 period, copper prices increased fivefold between 2003-2007.
Iron ore surged over 400% in the same timeframe.
These weren’t temporary dislocations, they reflected China building entire cities and infrastructure from scratch while global mining capacity couldn’t respond fast enough.
The silver supercycle thesis rests on a similar foundation. Industrial demand is accelerating from solar installations, electric vehicles, and electronics while mining production faces constraints that prevent rapid supply increases.
What makes this potential supercycle particularly interesting is the dual-engine dynamic: both industrial consumption and monetary demand are strengthening simultaneously.

Why Previous Silver Rallies Failed
Understanding past failures provides critical context for evaluating today’s situation. Silver has experienced dramatic rallies before, most notably during the Hunt Brothers episode of 1979-1980 and the 2008-2011 surge.
Both ended badly, teaching us what unsustainable rallies look like.
The Hunt Brothers accumulated roughly 200 million ounces of silver, representing over 10% of global supply at the time. They used massive leverage through futures contracts, creating artificial scarcity through speculative accumulation rather than genuine consumption.
When regulators introduced “Silver Rule 7” specifically designed to curb their activities and exchanges raised margin requirements, the entire structure collapsed. Silver plummeted from $48 to $11 in just eight weeks during March-April 1980.
This taught markets an important lesson: purely speculative rallies built on leverage inevitably unwind when regulatory pressure or margin calls force liquidation. The demand wasn’t real, it was financial engineering creating the illusion of scarcity.
The 2008-2011 rally exhibited different characteristics but ultimately suffered similar vulnerabilities. Initial gains from 2008-2009 reflected legitimate concerns about global financial stability and aggressive monetary easing.
By 2010-2011, the rally had transformed into a speculative frenzy.
Retail investors poured over $5 billion into silver ETFs. Online communities actively promoted short squeezes.
Price moves became increasingly divorced from industrial fundamentals.
When the European debt crisis intensified and the dollar strengthened in 2011, speculative positions unwound rapidly. Silver crashed from nearly $50 to below $30 in weeks, eventually grinding down to $14 by 2015.
The lesson here was equally clear: even rallies that begin with legitimate fundamentals become unsustainable when speculation overwhelms actual consumption.
What’s genuinely different about 2024-2025 is the industrial demand foundation. Solar panel installations, EV production, and electronics manufacturing represent real, physical consumption of silver that creates permanent supply reduction.
A solar panel installed in 2024 won’t return its silver to the market for 25-30 years.
An electric vehicle manufactured today locks up silver for the vehicle’s lifespan. This consumption pattern differs fundamentally from speculative accumulation that can be liquidated instantly when sentiment shifts.
The Industrial Demand Revolution
For the first time in modern history, industrial demand has become the primary driver of silver prices rather than monetary or speculative factors. This represents a profound structural shift with major implications.
Solar photovoltaic installations consume silver for conductive pathways in solar cells. Each panel needs silver paste for electrical contacts because silver’s conductivity and reliability stay superior to choices.
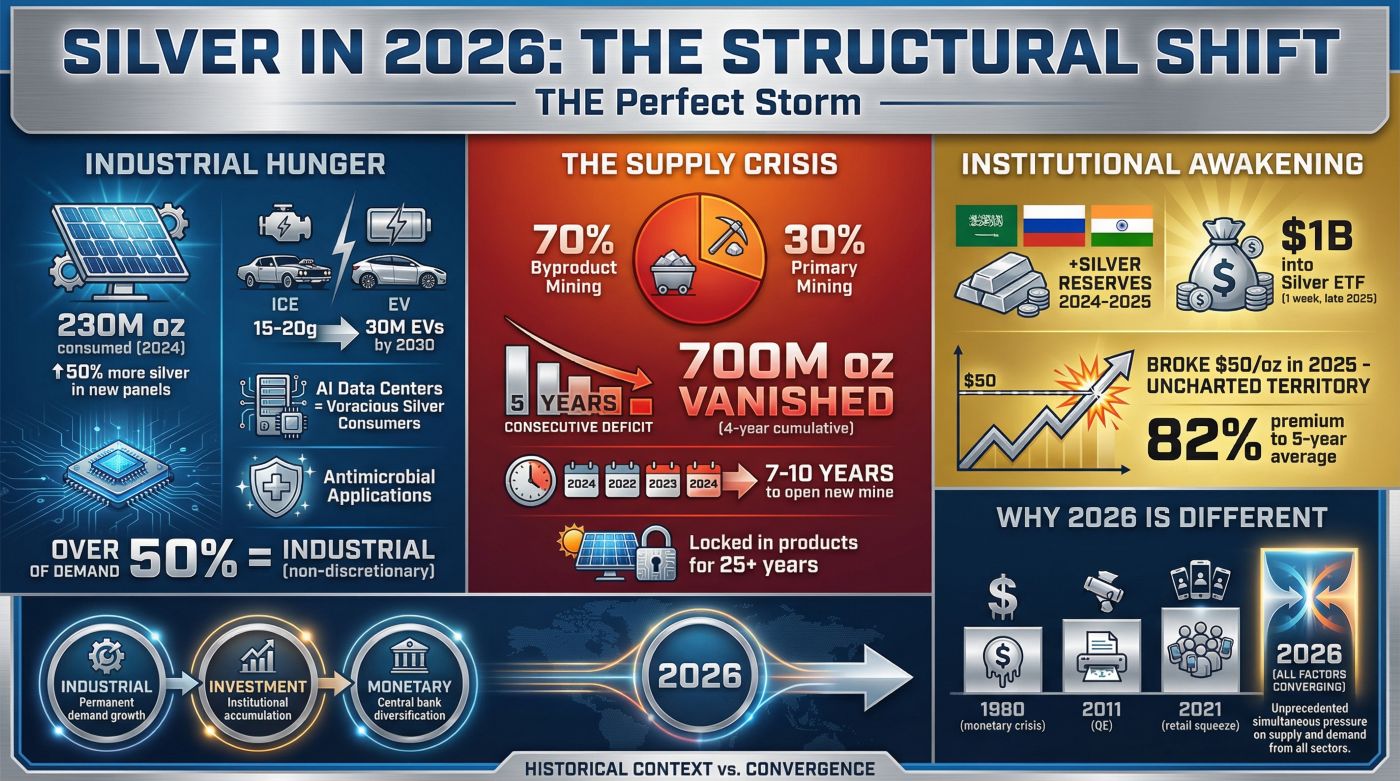
Current projections suggest photovoltaic demand alone will exceed 300 million ounces annually by 2030.
To put that in perspective, total annual silver mine production sits around 800-900 million ounces globally. One industry alone could soon consume one-third of all newly mined silver.
The counterintuitive aspect of solar demand involves efficiency improvements. As solar technology advances, manufacturers need less silver per watt generated. Total installations are growing exponentially faster than efficiency gains reduce per-panel consumption, though.
The net effect remains strongly positive for silver demand.
Advanced solar technologies like heterojunction cells actually need more silver than conventional designs, offsetting some efficiency improvements.
Electric vehicles create a second major demand vector. Each EV uses 25-50 grams of silver spread across sensors, electrical contacts, battery management systems, and power electronics.
That’s substantially more than conventional vehicles, which use roughly 15-30 grams.
As global EV production scales from roughly 10 million units in 2023 toward projected 30-40 million units by 2030, the silver requirement increases correspondingly.
What makes EV demand particularly sticky is the difficulty of substitution. Silver’s combination of electrical conductivity, thermal conductivity, and reliability in high-current applications makes it nearly irreplaceable for critical automotive safety and performance systems.
Manufacturers could potentially reduce silver content through engineering changes, but this needs extensive testing and regulatory approval, creating multi-year lag times before substitution meaningfully impacts demand.
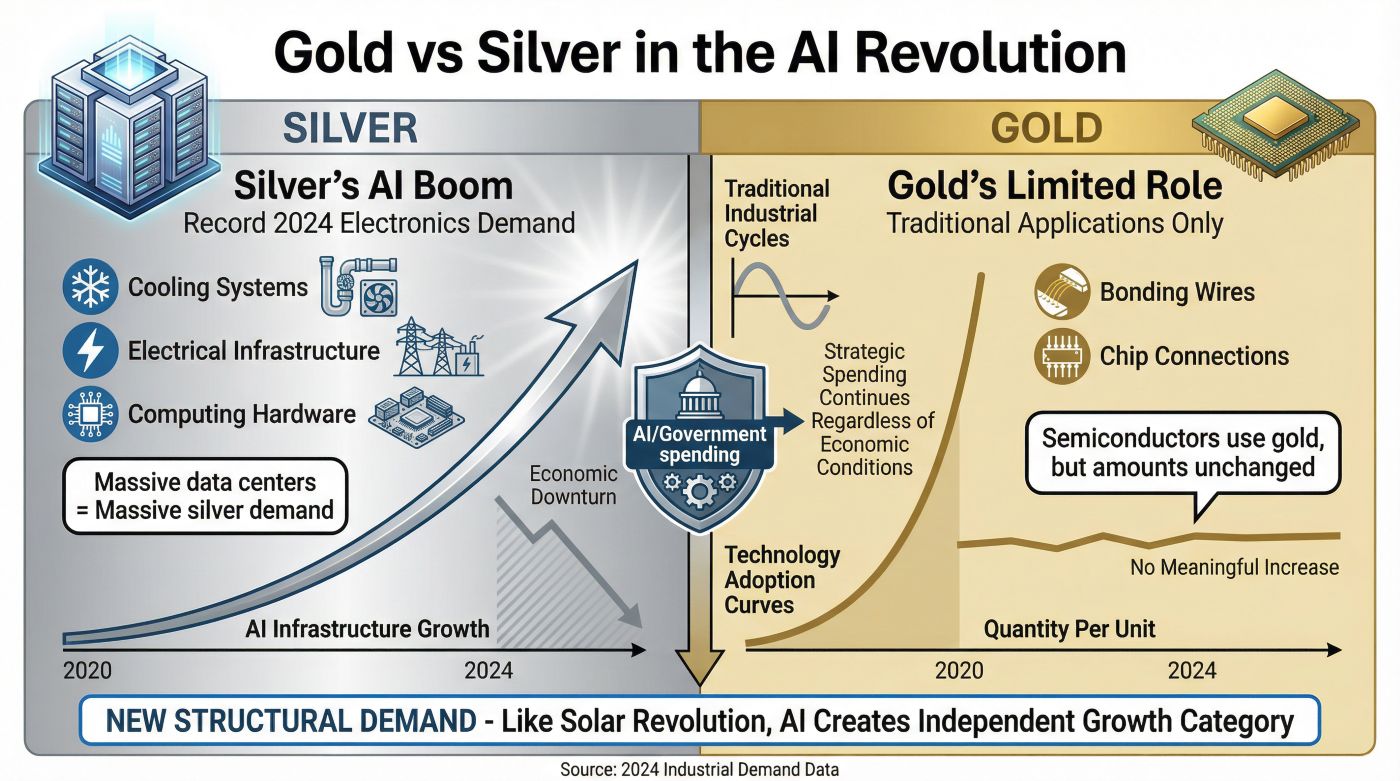
Consumer electronics represent the third pillar. Every smartphone, laptop, tablet, and AI server contains silver in printed circuit boards, switches, and connections.
The AI revolution has accelerated this demand vector unexpectedly.
Data centers supporting large language models and AI training need substantially more server capacity than previous computing generations. Each server contains silver in various components, multiplying consumption as AI infrastructure scales globally.
The combination of these three demand vectors, solar, EVs, and electronics, creates what analysts now describe as structural consumption. This differs from cyclical demand that rises and falls with economic conditions.
Solar installations are policy-driven through government mandates and climate commitments.
EV adoption follows regulatory timelines in Europe, China, and California that cannot be easily reversed. AI infrastructure investment reflects fundamental technology shifts rather than discretionary spending.
This demand foundation explains why current supply deficits have persisted for five consecutive years. Unlike speculative accumulation that reverses when prices spike, industrial consumption continues regardless of price because manufacturers have limited choices and face regulatory or technology constraints that prevent rapid substitution.
The Supply Constraint Reality
Mining companies cannot simply flip a switch and produce more silver when prices rise. The supply response to higher prices involves years of delays, creating the persistent imbalances that characterize supercycles.
Most silver comes as a byproduct of copper, lead, and zinc mining rather than dedicated silver operations. This creates an unusual supply dynamic where silver production depends heavily on decisions made for entirely different metals.
When copper prices are weak, mines may reduce production even if silver prices are strong, because the economics are driven by the primary metal.
This byproduct nature makes silver supply less responsive to price signals than other commodities.
New mining projects face extraordinary timelines. From initial discovery through exploration, permitting, construction, and commissioning, 5-10 years typically pass before a new mine produces commercial quantities.
The Terronera project illustrates this reality.
After five years of development and $258 million invested, the project only reached full production in late 2025. Despite strong silver prices throughout the development period, the project couldn’t speed up meaningfully beyond engineering and construction constraints.
Environmental and regulatory approvals create extra bottlenecks. Modern mining faces increasingly stringent environmental requirements, community consultation processes, and regulatory oversight.
These protections serve important purposes but significantly extend development timelines.
Projects that might have taken three years to allow in the 1980s now need five to seven years before breaking ground.
Existing mines face depletion curves and declining ore grades. As deposits age, miners must dig deeper and process lower-grade ore to maintain production, increasing costs and energy consumption.
Many major silver districts have been mined for decades or even centuries, with the highest-grade, most accessible deposits long exhausted.
The capital intensity of modern mining also constrains supply response. Building a new mine needs hundreds of millions or even billions of dollars in upfront investment.
Mining companies, having endured brutal commodity downturns in 2015-2020, stay cautious about overinvesting in new capacity.
They’ve learned that commodity rallies can reverse quickly, leaving expensive new mines producing into weak markets.
This combination of factors explains why silver supply has fallen short of demand for five consecutive years despite prices rising substantially. The supply deficit for 2025 alone is estimated between 120-240 million ounces.
That’s roughly 15-30% of total annual production, a staggering imbalance that would typically decide quickly in most markets.
The persistence of these deficits signals genuine structural constraints rather than temporary dislocations.
The Monetary Policy Catalyst
While industrial demand creates the foundation, monetary policy provided the catalyst that transformed gradual appreciation into an accelerating rally during 2024-2025.
Federal Reserve Chair Jerome Powell’s pivot toward rate cuts in 2024-2025 fundamentally changed the investment landscape. When central banks shift from restrictive to accommodative policy, capital rotates from yield-bearing instruments into hard assets and inflation hedges.
Silver, occupying the unique position of being both an industrial commodity and a monetary metal, captures flows from both categories simultaneously.
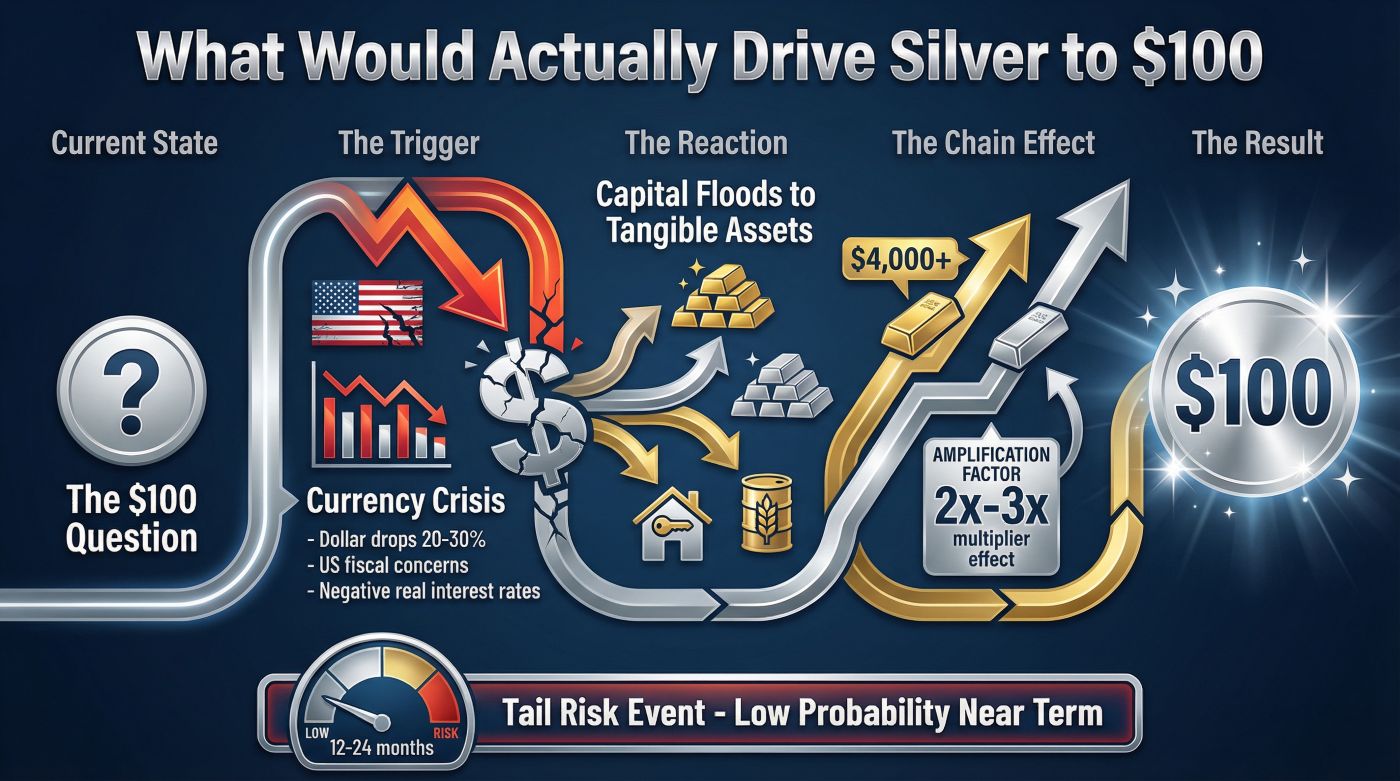
The historical parallel to the 1970s supercycle is striking. During that period, Federal Reserve rates fell below 5% while inflation soared above 10%, creating deeply negative real interest rates.
Investors fled currency into hard assets, driving silver from $6 to over $50, a gain exceeding 700%.
Today’s environment mirrors several of those conditions. While inflation hasn’t reached 1970s levels, the combination of rate cuts, persistent inflation concerns, and massive government debt creates similar incentives to seek protection outside traditional financial assets.
What makes the current situation particularly interesting is the dollar’s role. Historically, a strong dollar pressures commodity prices while a weak dollar supports them.
The dollar’s relative strength during 2022-2023 suppressed silver prices despite growing industrial demand.
As the Fed pivoted toward easing in 2024, the dollar weakened, removing this headwind and allowing industrial fundamentals to drive prices higher.
Central bank behavior adds an entirely new dimension. For millennia, silver functioned as monetary metal alongside gold, yet modern central banks largely ignored it despite holding substantial gold reserves.
Saudi Arabia’s first-ever silver reserve purchase in summer 2025 shattered this pattern.
If other central banks follow suit, viewing silver as a legitimate reserve asset rather than purely an industrial commodity, a demand shock from an entirely unexpected source could materialize.
The significance of central bank buying extends beyond the physical silver purchased. It represents institutional validation that silver deserves consideration as strategic reserve alongside gold. This psychological shift could influence other sovereign wealth funds, pension systems, and institutional investors who before viewed silver as too speculative or volatile for strategic allocation.
What the Charts Reveal
I’m generally skeptical of pure technical analysis, but when technical patterns align with fundamental factors, they often provide useful confirmation of structural changes underway.
Silver’s breach above $40 in 2024 represented more than a psychological milestone. That level served as resistance for over a decade, repelling many tries to break through during 2020-2023.
When commodities finally escape decade-long consolidation ranges, historical precedent suggests extended moves typically follow before new equilibrium establishes.
Several analysts have identified a massive cup-and-handle formation spanning roughly 45 years on silver charts. While such extremely long-term patterns are debatable, the basic concept holds interest.
Extended consolidation periods typically precede substantial breakout moves, with the consolidation duration often correlating to the eventual breakout magnitude.
Silver’s 2011-2024 consolidation, though painful for holders, built the foundation for the 2024-2025 acceleration.
The gold-to-silver ratio provides another useful framework. Historically, this ratio peaks around 100-125 during silver weakness and contracts to 40-60 during silver strength.
The ratio topped near 120 in March 2020 before contracting toward 80-85 by late 2024.
While this represents improvement for silver, substantial room remains for further ratio compression if historical patterns hold. A move to 60-65 would imply silver prices considerably higher than current levels even if gold remains unchanged.
Moving average crossovers confirmed the trend change during 2024. The 50-week moving average crossed above the 200-week moving average, generating what technicians call a “golden cross.” While these signals aren’t infallible, they often mark transitions from bear markets to bull markets in commodities.
What makes current technical action particularly compelling is the sustained follow-through. Silver hasn’t just spiked above resistance before collapsing back, it has maintained levels above $40-45 for extended periods through late 2024 and 2025.
This suggests genuine buying pressure and demand support rather than temporary squeeze dynamics that characterized previous failed breakouts.
The Challenges Nobody Discusses
Enthusiasm around supercycle narratives tends to overlook legitimate challenges that could derail or delay the thesis. Understanding these risks separates thoughtful analysis from cheerleading.
Substitution technology represents the most significant long-term threat. While silver’s properties make it irreplaceable today, sustained high prices create powerful incentives for research into choices.
Copper nanowires, carbon nanotubes, and other materials are being explored for various silver applications.
If breakthrough technologies emerge that offer acceptable performance at lower cost, industrial demand could decline faster than supply deficit models forecast.
The substitution risk carries an important nuance. Even if choices exist, implementation timelines span years.
Solar panel manufacturers can’t instantly switch to new materials without extensive testing, retooling manufacturing lines, and obtaining certifications.
Automotive companies face even longer qualification processes for safety-critical components. This means substitution threats, even when real, manifest gradually rather than overnight.
Recycling improvements represent another wildcard. Current silver recycling rates are relatively low compared to gold, creating opportunity for substantial improvement.
Emerging technologies for extracting silver from electronic waste are becoming increasingly sophisticated and economically viable.
Unlike virgin mining that faces geological constraints, recycling capacity can scale more rapidly when economics justify investment. A surge in recycling could offset some supply deficits more quickly than new mine development.
Economic recession poses cyclical risk. While industrial demand for solar and EVs is partly policy-driven, consumer electronics and many other silver applications stay economically sensitive.
A severe global recession could reduce industrial consumption meaningfully, even if temporarily, creating price pressure regardless of long-term fundamentals.
Regulatory intervention represents a tail risk often ignored. The Hunt Brothers experience demonstrated that governments can and will intervene in commodity markets when they perceive speculation creating instability. While current conditions differ from that episode, sustained rapid price increases that impact industrial costs could theoretically trigger policy responses, export restrictions, strategic reserve releases, or other interventions designed to moderate prices.
The geopolitical supply concentration deserves more attention. Because most silver comes as a byproduct of copper and zinc mining, geopolitical tensions affecting those metals could create unexpected silver supply shocks.
A significant portion of copper mining occurs in Chile and Peru, regions that face political instability periodically.
Zinc mining concentrates in China, Australia, and Peru. Disruptions to these primary metals automatically impact silver supply regardless of silver-specific market conditions.
Navigating the Supercycle as an Observer
Whether you’re directly involved in silver markets or simply watching this unfold, several frameworks help assess whether the supercycle thesis is playing out as proponents suggest.
Pay attention to supply deficit persistence. If annual supply shortfalls continue for several more years despite higher prices, that confirms supply constraints are real rather than temporary.
Conversely, if deficits rapidly close as prices rise, that suggests supply is more elastic than supercycle proponents believe.
Monitor industrial demand growth trajectories. Solar installation data, EV production figures, and electronics consumption statistics are publicly available.
If these continue growing at projected rates, industrial consumption will likely stay robust.
If growth disappoints, whether from technology changes, policy shifts, or economic weakness, the demand foundation weakens correspondingly.
Watch central bank behavior closely. If Saudi Arabia’s silver purchase represents the beginning of broader central bank accumulation, that introduces an entirely new demand vector that supply deficit models don’t now incorporate.
Conversely, if no other central banks follow suit, the Saudi purchase might represent an isolated decision rather than a trend.
Price action during corrections provides crucial information. Supercycles experience pullbacks and consolidations, but these typically find support at progressively higher levels as the structural imbalance continues.
If silver corrects 20-30% but stabilizes above previous resistance levels, that suggests underlying strength.
If corrections fully retrace recent gains, that indicates weaker fundamentals than bulls expect.
Manufacturing cost pressures offer another signal. If major electronics manufacturers, automotive companies, or solar producers begin publicly discussing silver costs as a margin pressure, that confirms prices are high enough to matter.
Watch for announcements about substitution programs, recycling initiatives, or calls for government intervention.
These responses show prices are creating genuine industrial pain rather than remaining easily absorbed business costs.
Analyst price target evolution reveals institutional thinking. When major investment banks progressively raise targets, as UBS and Bank of America did during 2024-2025, that signals their fundamental analysis is identifying stronger conditions than before assumed. Conversely, if institutions begin walking back aggressive targets, that suggests weakening conviction in the thesis.
What History Teaches About Timing
Supercycles create enormous wealth transfers, but timing remains extraordinarily difficult. Historical patterns offer some guidance, though each cycle exhibits unique characteristics.
Silver typically lags gold in the early stages of precious metals bull markets before accelerating in later phases. During 1976-1980, gold gained 700% while silver surged 1,100%.
During 2001-2011, gold rose 660% while silver gained 900%.
This lagging-then-accelerating pattern suggests the most explosive silver gains often occur mid-to-late in precious metals supercycles.
If we’re now in early-to-middle stages of a potential supercycle, as many analysts suggest, this implies more substantial appreciation might lie ahead. This assumes the pattern repeats, though, which isn’t guaranteed. Each supercycle responds to its specific economic, monetary, and geopolitical context.
The 1970s supercycle lasted roughly 10 years from initial breakout to peak, though the most explosive gains compressed into the final 3-4 years. The 2000s commodity supercycle ran approximately 12 years with similar acceleration in later stages.
These timelines suggest supercycles, once established, typically continue longer than most investors expect but deliver gains unevenly across their duration.
Corrections within supercycles can be savage. Even during the 1970s silver bull market, many 30-40% corrections occurred before the final surge to $50.
Investors who panicked during these corrections missed subsequent gains.
Conversely, investors who held through the $50 peak suffered devastating losses as prices collapsed 80% over the following months. This underscores the difficulty of timing, even when the fundamental thesis proves fix, execution remains challenging.
People Also Asked
What is driving silver prices up in 2025?
Silver prices in 2025 are being driven primarily by industrial demand from solar panel manufacturing, electric vehicle production, and electronics. These sectors consume physical silver that gets permanently locked into products for decades.
Additionally, Federal Reserve rate cuts have weakened the dollar and increased investor interest in hard assets, providing monetary support alongside industrial consumption growth.
How much silver is used in solar panels?
Each solar panel now uses approximately 20-30 grams of silver in conductive paste for electrical contacts. While manufacturers are working to reduce silver content per panel through efficiency improvements, total solar installations are growing faster than per-panel consumption is declining.
Industry projections suggest solar photovoltaic demand will exceed 300 million ounces annually by 2030, representing roughly one-third of total global silver production.
Why do electric vehicles need silver?
Electric vehicles use 25-50 grams of silver per vehicle, substantially more than conventional cars which use 15-30 grams. Silver appears in EV sensors, electrical contacts, battery management systems, and power electronics because of its superior electrical conductivity, thermal conductivity, and reliability in high-current applications.
These properties make silver difficult to substitute in safety-critical automotive systems without extensive testing and regulatory approval.
Can silver be recycled from electronics?
Silver can be recycled from electronic waste through increasingly sophisticated extraction technologies. Current recycling rates stay relatively low compared to gold, creating opportunities for improvement.
Unlike mining operations that face geological constraints and multi-year development timelines, recycling capacity can potentially scale more rapidly when economics justify investment.
Growing recycling volumes could offset some of the supply deficits faster than new mine development.
What happened to silver prices in the 1980s?
Silver reached $50 in January 1980 during the Hunt Brothers episode, where two investors accumulated over 200 million ounces using massive leverage through futures contracts. When regulators introduced new rules and exchanges raised margin requirements, the speculative structure collapsed. Silver plummeted from $48 to $11 in eight weeks during March-April 1980, demonstrating how purely speculative rallies built on leverage inevitably unwind under regulatory pressure or margin calls.
How long do supercycles typically last?
Historical commodity supercycles have lasted 10-20+ years, driven by structural supply-demand imbalances that cannot be quickly resolved. The 1970s supercycle ran roughly 10 years, while the 2000s commodity supercycle lasted approximately 12 years. These extended periods differ dramatically from shorter bull markets that last months or a few years, with supercycles typically delivering price increases exceeding 300% while persisting through economic cycles and recessions.
What is the gold-to-silver ratio?
The gold-to-silver ratio measures how many ounces of silver equal the price of one ounce of gold. Historically, this ratio peaks around 100-125 during periods of silver weakness and contracts to 40-60 during silver strength.
The ratio reached nearly 120 in March 2020 before contracting toward 80-85 by late 2024, suggesting substantial room for further compression if historical patterns continue.
Key Takeaways
The silver supercycle thesis rests on genuine structural foundations, specifically persistent supply deficits meeting accelerating industrial demand from solar, EVs, and electronics rather than speculation alone.
Historical supercycles typically deliver 300%+ gains over 10-20 year periods, driven by structural imbalances that cannot be quickly resolved, distinguishing them from temporary bull markets.
Current conditions uniquely mix industrial consumption growth with monetary policy support and emerging central bank participation, creating a dual-engine dynamic that hasn’t before occurred in silver markets.
Supply constraints from mining timelines, byproduct nature, and capital intensity mean deficits will likely continue for years despite higher prices, providing fundamental support for extended appreciation.
The breach above decade-long resistance at $40, combined with institutional price targets rising to $55-$65+ by 2026, suggests a structural shift is underway rather than a temporary spike.
Previous silver rallies failed because they relied on speculation and leverage rather than genuine industrial consumption, whereas current demand from solar panels, EVs, and electronics creates real, sustained consumption that permanently removes silver from markets.
Risks including substitution technology, improved recycling, economic recession, and potential regulatory intervention could derail or delay the supercycle, requiring ongoing monitoring of supply-demand dynamics rather than assuming linear progression.